Introduction Despite intensive study, a comprehensive understanding of the structure of capital markets exchange trading data remains elusive. For an overview of this issue, see Chapter 5 of Sonification and Information, including more detail of the techniques illustrated here, or just read a brief overview of market data.
In our first example of the sonification of market data we considered ways to sonify daily closing prices of a broad market indicator and statistically related datasets. In this example we consider how to characterise intraday activity of an exchange-trading market. The opportunity to work with intraday data trading engine data was afforded by a formally-agreed exploratory project with the Capital Markets Cooperative Research Centre (CMCRC), a private-sector/university partnership. The broad question was Can the sonification of intra-day data from the capital markets provide with insights into activity in these markets not afforded by other display techniques?
The dataset The dataset used for these examples is a multiplexion of all the on–market TRADEs of a single day on an exchange of approximately 3000 trading instruments. Before sonification can be undertaken, the data has to be checked for integrity so that transmission and other errors that 'creap into' it can be eliminated or repaired. Because of the size of the datasets, this is rarely possible to do this by visual inspection alone: algorithic processes need to be developed. The data cleaning method was to iteratively develop and modify a series of active filters built around Python’s regular expression-matching capabilities, until all the data parsed correctly. Checking data for integrity is a larger topic that can adequately be covered in this context. Suffice it to say, using an interpretive language like Python assists in the interative development of cleaning scripts.
Experiment: The sonification of $value and volatility The aim of ths experiment is to provide a means by which a musically-naïve listener can aurally observe something of the nature and extent of the way value, measured in monetary terms, changes ownership during a trading day.
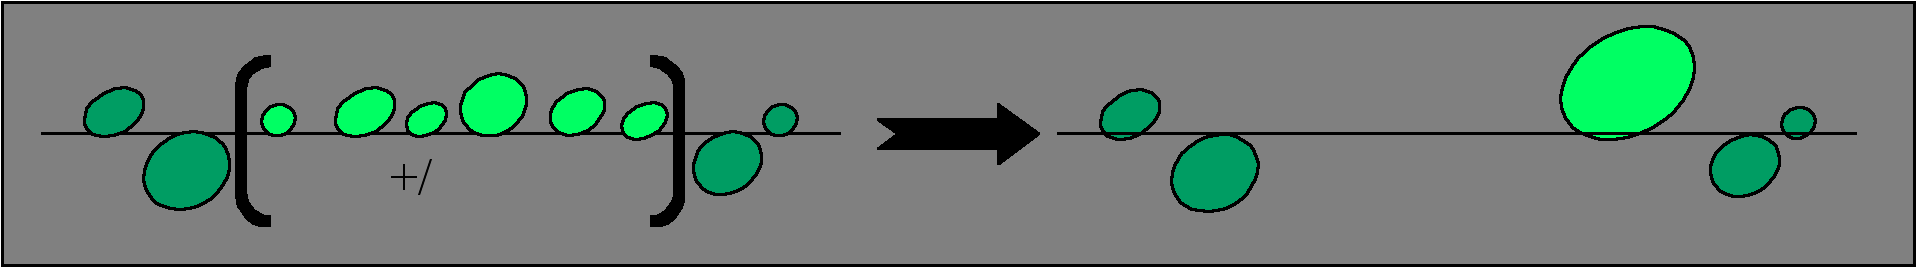
A statistical analysis of the datset described above reveals that in each security there is a preponderance of small-$valued trades (in the $3000-5000K range), including many at the same price. For the purposes of this sonification, all all trades that occurred sequentially at the same price were accumulated into a single sonification event. This process is illustrated graphically in Figure 1.
Figure 1. A graphical representation of the accumulation filter applied to the TRADE data. $value trades in a security are accumulated until the price changes, at which point the accumulated value is sonified. On the left-hand side, The dark-green circles represent trades sonified without accumulation because price has changed beforehand. The smaller light-green circles represent accumulating TRADEs (+/). The right-hand side illustrates the overall result.
The mapping There is no simple relationship between the traded price of an individual unit of a security and that of an individual unit of another security. However, one way to meaningfully compare securities being traded is by comparing the monetary value of trades ($value hereafter). To effect this sonification, intraday TRADE data was adapted to a model of $value; that is, one that could reflect the relative importance of trades in a market at a given time by comparing their commonality: amounts of a finite resource (money). Without wishing to overstress the point, the task is thus of the sonification of human-valued information.
Perceptually, the size of an object is habitually related to its mass, as evidenced by the surprise when picking up a large piece of pumice. Portentous objects and events in the natural world are more usually associated with lower-pitched, less frequent sounds. For example, there appears to be many more small birds than large ones, and so on. A basic statistical analysis of the TRADE data reveals proportionally fewer high-$value trades than low-$value trades, indicating that $value is in line with these principles outlined, as symbolically illustrated in Figure 2.
Figure 2. Symbolic representation of the relationship between size and value.
Similarly, there appears to be an inverse relationship between the duration of an event type and its frequency (of occurrence). When compared to smaller events, larger events in the same domain occur less often and last for a longer period of time than smaller ones: the snap of a twig is more frequent and shorter than the crash of a tree, the scurry of mice more frequent than a stampede of elephants etc. So, when sonifying larger $valued trades at lower frequencies, it is necessary to increase their relative duration, comparatively.
These generalised relationships are also in evidence in the evolution of the logarithmic ‘mappings’ between psychophysical, physical and psychological phenomena. For example, it takes longer for the pitch of sound in the range of 30–50 Hz to be determined than it does for one in the 300–500 Hz range. A similar psychological relationship can be observed in changes in perceived financial value; accounting for why $value is measured in the percentage gain or loss rather than in absolute amounts.
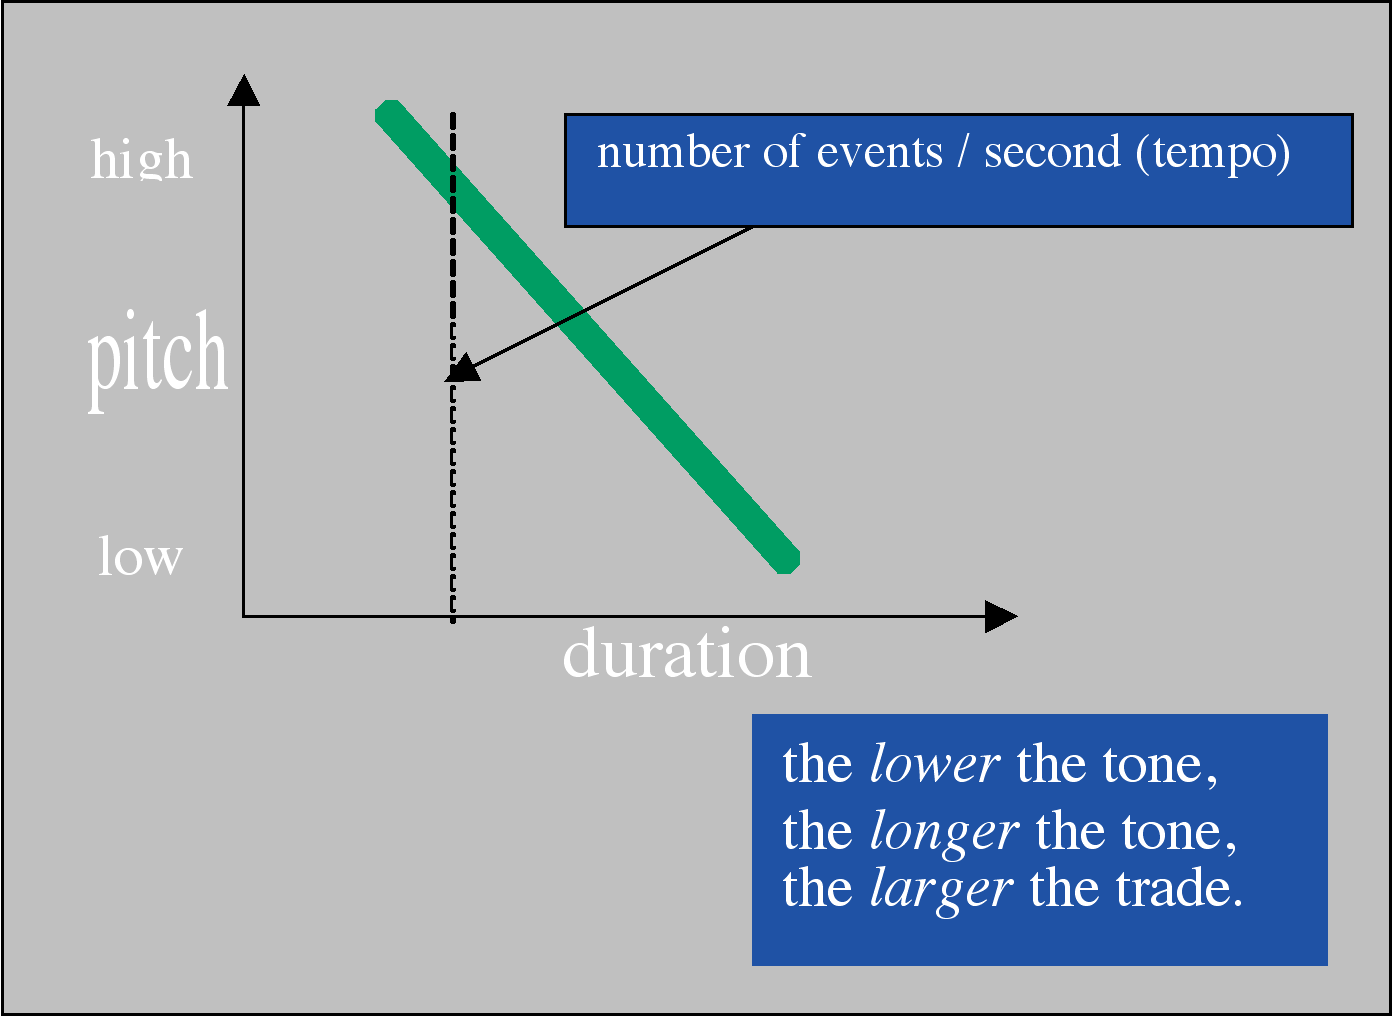
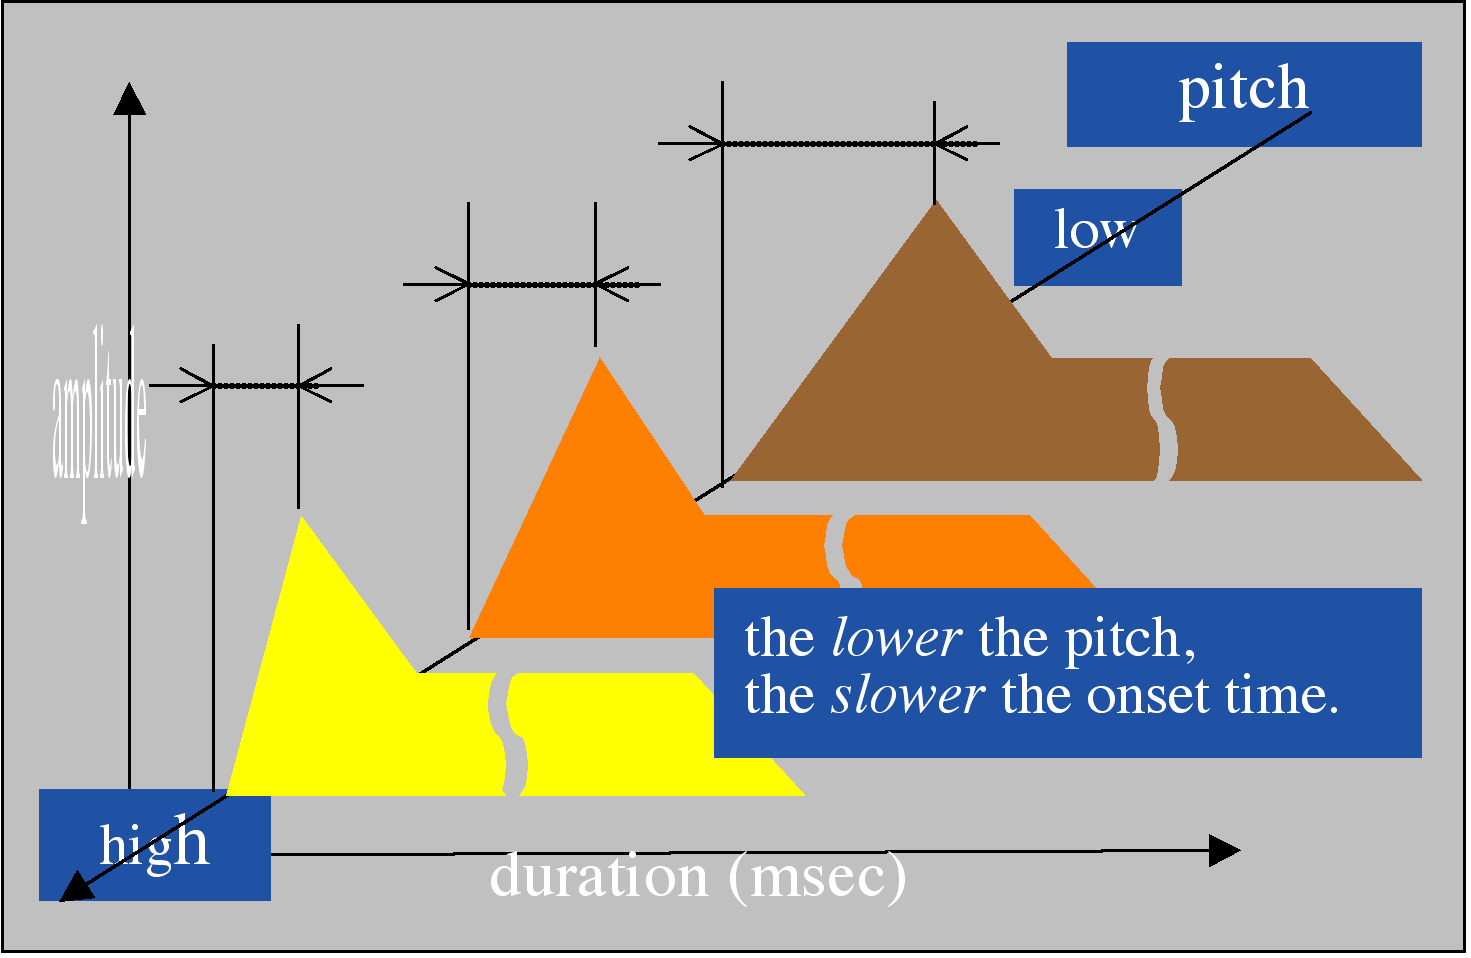
So, for the reasons just outlined, in this experiment, a proportional inverse mapping was applied between sound frequency and the $value of each trade accumulation. The psychoacoustic mapping as are illustrated in Figure 3 between pitch and duration, and in Figure 4, between a tone’s onset–time and pitch.
Figure 3. The principle information mappings $value is inversely- proportional to pitch and the lower the tone the longer the duration. Notice that the pitch (green line) is linear, implying and exponential frequency scale.
Figure 4. A second psychoacoustic adjustment: larger $values (lower–pitched) have slower onset–times in keeping with physical characteristics of material resonators.
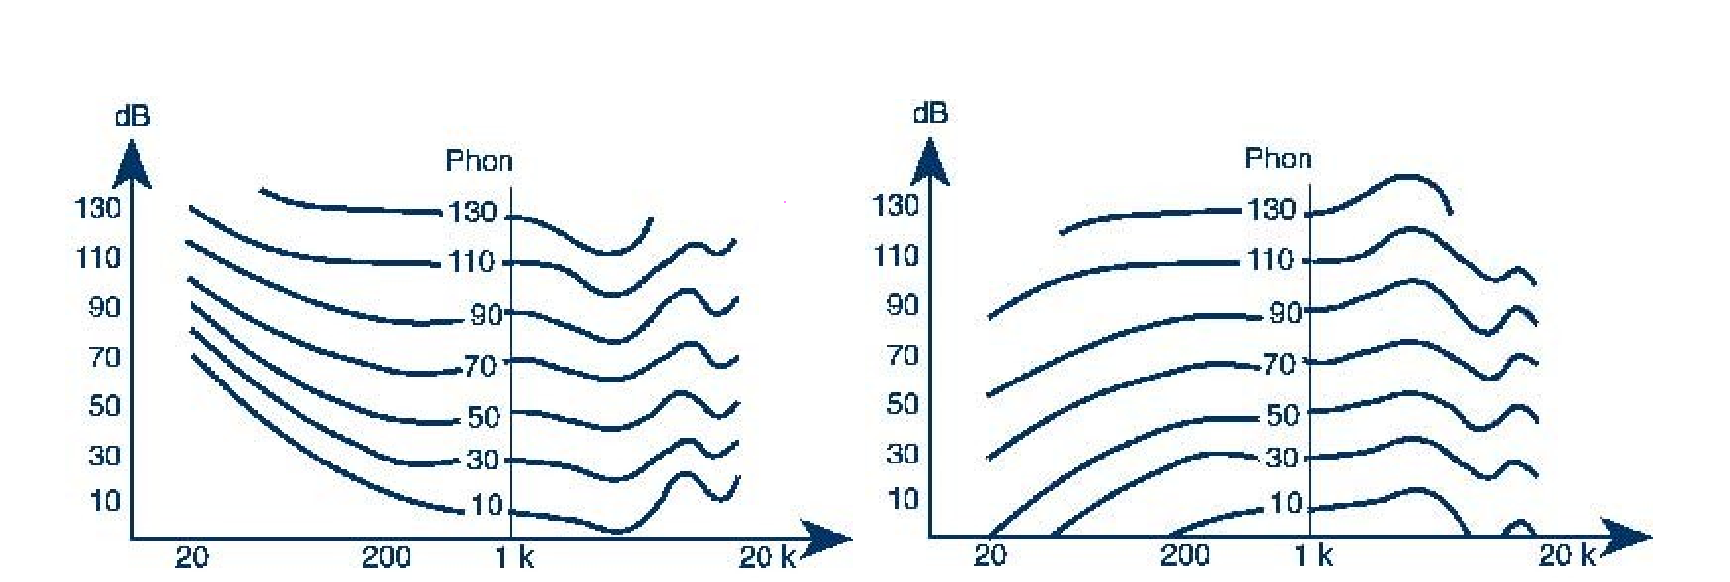
A further psychoacoustic adjustment was made using a very basic ‘inverse Fletcher–Munson curve of equal loudness‘, as illustrated in Figure 5. This adjustment is applied to counter–balance the known psychoacoustic phenomena that the centre of the pitch gamut of human hearing is more amplitude–sensitive than at the extremes.
Figure 4. Fletcher Munson curves of equal loudness (left) and its inverse.
The sound rendering instrument The csound instrument used to render this new dataset to sound was designed for straightforward fine adjustment of the acoustic–psychoacoustic relationships: the emphasis being on clarity of articulation rather than complexity of timbre.
Some examples
Here is a sonification of a full day's trading using the above mapping. Time has been compressed 60 times, so on minute of trading is represented by one second of audio.
Low-pitched tones represent large $values. Clearly, small trades dominate the market Here is a preponderance of smaller $value trades. Here is a sonification of 30 minutes of market time in which all trade accumulations less that $50,000 have been filtered out.Play 30 minutes of trades > $50K (528K MP3 file) Time ratio: 1:60
Comments Because of the accumulation technique employed, the five Market On Open events (the incremental opening of the market in groups) are not well pronounced. The middle of the day clearly has less activity – lunchtime perhaps – and the increased activity and volatility towards the end of the trading day is quite noticeable, especially in the last fifteen or twenty minutes of trading. Also clear, is the Market On Close event, on the day presented in this example, there is only one. In the second example, there is still a relative preponderance of smaller–$value trades, but that is to be expected. The volatility of the market can be easily inferred from this mapping.
Adding a second mapping Here is another experiment with the cumulative mapping technique employed above. A sonification event only occurs when the price changes so, to each event a second pitch is appended to indicate whether the TRADE that triggered the sonification event was a decrease or increase movement in price. The pitch of that tone is higher when the price increased and lower when it decreased; the size of the interval between the two tones indicating the extent of the price difference. Notice this use of a rise in pitch to represent a rise in $value is the opposite of that used to represent $value itself, where a lower pitch represents a higher $value.
Here is the technique applied to the middle of the day:
Comments There appears to be no difficulty in cognitively separating the two opposing mapping paradigms when they are superimposed. None appeared to have any difficulty in separating the two paradigms. In fact, without being informed of the opposition, most listeners tested were not aware of the conflict in the first place!
This informal experiment illustrates that it is possible for superimposed concepts to be easily separated cognitively even when mapping of the two paradigms into the same psychoacoustic space is opposed: intention, that is information, can take precedence over perception and sensation when given the conditions to do so.